Retail Doesn’t Have a Data Problem. It Has a Data Blind Spot.
The retail data blind spot is not a new phenomenon. But it is one that the food and beverage industry has largely learned to live with, quietly absorbing the cost, filling the gaps with instinct, and moving on to the next event, the next season, the next reset.
Having worked across food service operations, distribution networks, CPG brands, and retail environments, Stoc has seen this pattern show up consistently regardless of company size, segment, or geography. It is not that the industry lacks the will to make smarter decisions. It is that the data needed to make those decisions is either not being captured, not connected, or not surfaced in a way that people can actually act on.
The gap is structural. And it is costing the industry more than most operations realize.
The Start of Every Shift
Picture the start of a shift. A cooler gets stocked. Product is organized, gaps are filled, the door gets closed. The team moves on to the next location, the next task, the next thing on the list.
And then the day happens.
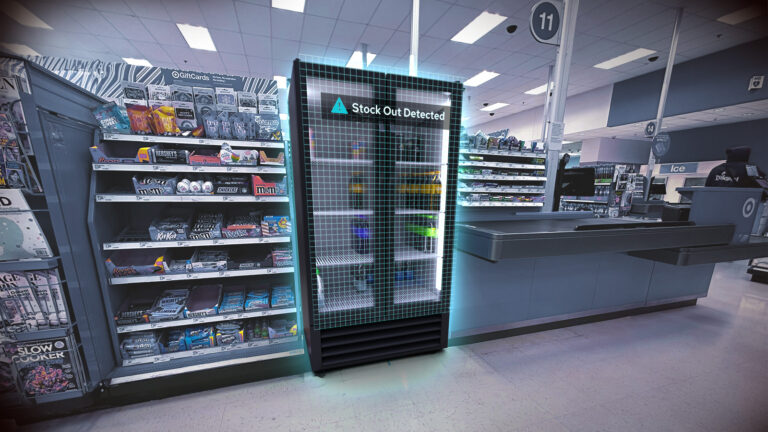
For the next several hours, sometimes up to 24, no one has real visibility into what is happening inside that cooler. Products may be selling out. A unit may be running warm. Gaps may be opening across the shelf. And unless someone physically goes back to look, none of it registers anywhere. There is no alert. There is no flag. There is just silence, and the assumption that things are probably fine.
This is not an edge case. Stoc has seen this in food service environments, in retail locations, and across distribution networks of every size. The terminology changes and the scale differs, but the dynamic is the same everywhere: a cooler or shelf gets set up once, and then it is largely on its own until the next visit.
Ask how shelf performance gets tracked in most operations and the honest answer is that it mostly does not. Not in real time. Not at the cooler level. What exists is a combination of manual check-ins scheduled by habit, disconnected tools that were never designed to work together, and a heavy reliance on whatever the point-of-sale system reports at the end of the day.
That is the retail data blind spot in its most basic form. Not data that was collected incorrectly. Data that was never collected at all.
The Only Number Anyone Is Watching
So if real-time shelf data is not being captured, what are operations actually working with? In almost every case Stoc has encountered, the answer is the same: sales data. Point of sale. What moved through the register and what revenue it generated.
That number matters. But on its own, it tells less than half the story.
Sales data captures what sold. It does not capture what could not sell because the shelf was empty. It does not show how long a product was unavailable, which specific cooler the gap occurred in, or how many customers encountered an empty slot and walked away. And it does not reveal whether a product that looks like a consistent underperformer is actually a high-velocity item that keeps stocking out before it has a chance to accumulate meaningful numbers.
There is a granularity problem on top of that. In a venue with multiple coolers all carrying the same product, point-of-sale systems typically return one aggregated number across all of them. No cooler-level breakdown. No location-level signal. Just a total. Which makes it nearly impossible to identify where within an operation performance is breaking down, and why.
The picture most operations are working from is not a full picture. It is a revenue summary. And everything underneath that number, the availability, the gaps, the missed opportunities, is invisible.
What Nobody Is Talking About
Here is where the story gets more specific, because there is a gap inside this gap that rarely gets named.
Operations know two things with reasonable confidence: what was ordered and delivered to a location, and what eventually sold at the register. But everything that happens in between, from the moment inventory hits the floor to the moment a product clears checkout, is largely a black box.
Was product placed correctly after delivery? Did a cooler run warm and quietly suppress sales for an entire shift before anyone noticed? Did a promotion that originated at the corporate level actually make it to the shelf, or did it get lost somewhere between the director who announced it and the person physically setting the product that morning? Did a high-demand item sell out two hours into a peak event, leaving that slot empty and invisible for the rest of the day?
None of those questions get answered by sales data. And in the absence of answers, operations continue on assumptions. Some of those assumptions are accurate. Many are not.
The industry knows what came in. It knows what went out. What happened in between is the retail data blind spot at its most consequential, and it is the part of the operation where the most money quietly disappears.
The Data That Does Exist Is Scattered
Now compound that with a second layer: even when data does exist somewhere inside an organization, getting to it is its own challenge.
Different teams own different markets. Different markets run on different systems. In larger enterprises, it is not uncommon for multiple teams to be working on the same problem in parallel, building separate analyses and drawing separate conclusions, without any awareness of each other’s work. The request for a consolidated view across a network of locations, something that should feel routine, can take days, weeks, or months to pull together. And in some cases, the data needed simply does not exist in a retrievable form at all.
The tools across the industry were not built with integration in mind. A planogram creation tool does its job. An ERP system does its job. A POS platform does its job. None of them talk to each other by default, and connecting the dots between them falls entirely to the people running the operation.
What that looks like in practice is more manual than most people outside the industry would expect. Stoc has encountered operations where a planogram change gets communicated by texting a photo of the cooler to a manager. No log. No record. No confirmation that anyone downstream received it, understood it, or acted on it. That photo might be the closest thing to a system of record that location has.
At smaller operations, this is manageable, if imperfect. At larger ones, with dozens or hundreds of locations all running slightly differently, it becomes a real structural problem. More scale does not fix the fragmentation. It compounds it.
So Experience Steps In
When clean, localized, real-time data is not available, something has to fill the gap. And in most operations, what fills it is experience: professional judgment, pattern recognition, and the kind of institutional knowledge that lives in people rather than systems.
This is understandable. Experienced operators know their environments. They have rhythms they can read and instincts built over years of doing the work. But even the sharpest institutional knowledge has a ceiling, and that ceiling becomes most visible when conditions change, when a new product enters the mix, when a venue shifts its event schedule, when a promotion lands differently than expected.
Stoc has heard operators acknowledge this directly, and with a candor that is worth noting. One industry veteran with decades of experience said plainly that they were making decisions based on what they thought was right, not what data confirmed was right. And they were genuinely curious to see what a data-driven decision would produce. That kind of honest self-awareness is not rare inside the industry. What is rare is having the data to act on it.
The consequences of running on instinct instead of information are specific and recurring. Planogram resets that have not happened in two years, not from negligence, but because nothing in the available data created urgency for change. Promotions that corporate teams rolled out that never made it to the shelf. High-velocity products quietly removed from the assortment because their sales numbers looked low, when the real issue was that they were stocking out too fast to accumulate meaningful volume. Merchandising schedules built around a calendar and a habit rather than any real signal about what is actually happening inside the cooler.
The data-driven decision and the instinct-driven decision often point in different directions. Without the data, there is no way to know which direction is right.
What All of This Actually Costs
At this point it is worth stepping back and putting a number to what has been described, because the retail data blind spot is not just an operational inconvenience. It has a real dollar figure attached to it.
Stockouts in the U.S. retail food industry alone are estimated to cost between $15 billion and $20 billion in lost sales every year [1]. Globally, out-of-stocks and overstocks together account for over $1.75 trillion in annual retail losses [2]. Research from NielsenIQ found that out-of-stock events cause 46% of retailers to lose the sale entirely, meaning the customer delays, goes somewhere else, or skips the purchase altogether [3].
Those numbers are industry-wide. But the blind spot lives at the micro level too, and that is where it becomes personal.
Consider a single cooler at a single location during a single event. A product is available for ten hours. It sells out after two. For the remaining eight hours, that slot sits empty. The revenue from those eight hours is gone. Not deferred, not captured later. Gone. Multiply that across multiple products, multiple coolers, and a full network of locations, and the number grows fast.
Sales reports capture what was generated. They do not capture what was missed. Those two numbers together tell a fundamentally different story than sales data alone. And across the food and beverage industry, most operations have only ever seen half of it.
There are operational costs too, quieter but just as real. Time spent manually visiting locations that did not need attention. Merchandising trips dispatched on a schedule instead of in response to an actual signal. Labor allocated to routine rather than need. These are not isolated inefficiencies. They are systemic ones, running in the background of operations across the industry every single day.
What the Industry Is Really Asking For
After working inside these environments across multiple sectors, Stoc has heard a version of the same request more times than can be counted. It does not sound like a technology ask. It sounds like a basic business one.
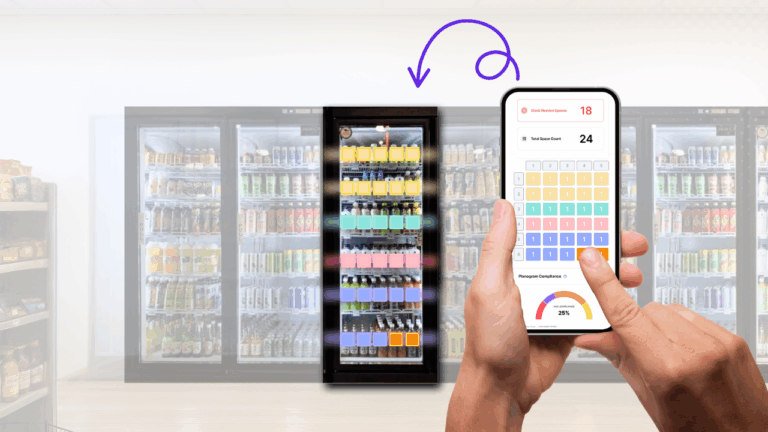
Operators want a source of truth. One place that shows how a network is performing, what needs to change, and what those changes are worth. Not national benchmarks or aggregated industry averages, but data from their own floors, their own coolers, their own customers at their own venues. This is the core ask that sits underneath the retail data blind spot conversation, across every segment.
They want planogram and assortment decisions driven by what is actually happening on the shelf right now, not by what happened last quarter or last year somewhere else. They want to know when something goes wrong before the next scheduled visit. They want to stop finding out a cooler ran warm 24 hours after the fact, when the window to act on it has already closed.
And they are not asking to become data analysts to get there. These are operators running complex, fast-moving environments: managing staff, executing events, negotiating contracts, keeping shelves full. The data needs to arrive in a form that tells people what to do, not one that asks them to figure it out themselves. As one operator put it to Stoc directly, they did not want more numbers. They wanted to know what the numbers meant and what to do next.
The clearest version of that Stoc has ever heard came from an operator who had been working with Stoc long enough to know the difference between before and after. They said they loved it because they no longer had to think about their coolers. They just knew what was going on and what to do.
That is what a source of truth looks like when it actually works. And it is what the food and beverage industry has been asking for, in one form or another, for a long time.
FAQ
Sources
[1] NetSuite, Stockouts Defined: https://www.netsuite.com/portal/resource/articles/inventory-management/stockout.shtml
[2] ToolsGroup, The Hidden Costs of Poor Inventory Management: https://www.toolsgroup.com/blog/the-hidden-costs-of-poor-inventory-management-how-much-are-you-really-losing/
[3] Supermarket News, Grocery Retailers and Customers Paying the Price for Disruptions: https://www.supermarketnews.com/issues-trends/grocery-retailers-customers-paying-price