What Happens When the Deadly Blind Spot Disappears?
The food and beverage visibility gap is not a technology problem. It is a business one. And it starts with a question the industry has not had a good answer to yet: what actually changes when operations can finally see the full picture?
The previous post walked through the structural blind spot running across food service, distribution, and retail. Missing shelf-level data. Decisions made on lagging sales numbers. The gap between what was ordered and what sold, and everything that disappeared in between.
This post asks what becomes possible when that gap closes.
The Question Nobody Is Asking
Most conversations about data in food and beverage land on the same things: better dashboards, faster reporting, cleaner exports. The focus stays on the data itself, where it lives, how to pull it.
Stoc has found, working across distributors, food service operators, and convenience retailers, that the more important question rarely gets asked. Not how do we get more data, but what would we do differently if we actually had it?
That question changes everything. The answer is not a list of operational tweaks. It is a fundamentally different way of running the business.
Someone who has been wearing the wrong prescription their whole life is not just squinting. They are compensating for what they cannot see, building habits around a distorted picture. Give them the right glasses and the world does not just get clearer. The entire way they move through it changes.
That is what closing the food and beverage visibility gap looks like in practice.
Imagine Actually Knowing
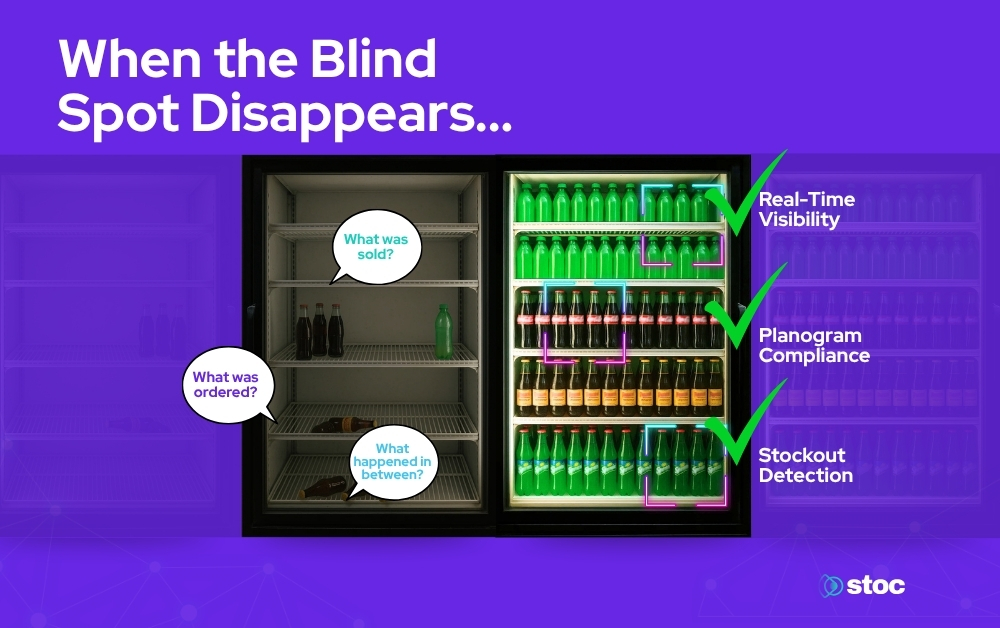
Most operations know two things with confidence: what was ordered and what was sold. Everything in between is inference and guesswork. A cooler gets stocked in the morning and is on its own until someone walks back to check it. A promotion gets announced from corporate and may or may not reach the actual shelf. A product underperforms on the sales report and gets cut from the planogram, even though the real reason it underperformed is that it was stocking out every afternoon before the evening rush.
Now imagine knowing all of it. Which coolers need attention. Which products are high demand but chronically under-faced. Which locations have drifted from the planogram. What the gap between what sold and what could have sold looks like in dollars, at the cooler level, in real time.
That is not a dashboard upgrade. That is a different operating reality.
What Changes for Distributors
For distributors, the food and beverage visibility gap shows up in scheduling. Routes run on fixed cycles. Coolers get visited on a schedule regardless of what is happening inside them. The merchandiser shows up, assesses the situation on arrival, and works from there.
The result is unnecessary trips and missed moments. A cooler that needed attention at 2pm gets visited the next morning. A cooler that was fully stocked gets a visit it did not need.
Close the visibility gap and routes get built around demand signals instead of calendars. Trips happen when they are needed. Labor savings compound quickly across a network.
For distributors in shared cooler environments, where multiple suppliers merchandise different sections of the same unit, visibility data changes the negotiation entirely. Instead of arguing from historical sales numbers, they can see performance at the slot level, where their products are outperforming, and where the other side of the cooler is underdelivering. That is a different position to negotiate from.
What Changes for Food Service Operators
For food service operators, the most immediate change is the end of physical audits as the primary source of truth.
Walking coolers is time-consuming and imprecise. A check at 9am says nothing about what happened during the lunch rush or the two hours before close. Across a stadium, airport terminal, or corporate dining network, the hours spent verifying that coolers are stocked, at temperature, and planogram-compliant add up to significant labor with limited return.
Close the visibility gap and that time gets reallocated. Operators know what needs attention before they go anywhere. Issues surface as they happen. The decision about when to dispatch someone is driven by a real signal, not a routine.
The planogram effect is significant too. Resets happen infrequently in most operations, driven by contract changes or mandates rather than performance data. Stoc has encountered operations where planogram resets are measured in years, not months, not because the setup is performing well, but because nothing in the available data is creating urgency to change it. Close the visibility gap and planogram decisions become continuous. The question shifts from when do we do a reset to what should we adjust this week.
What Changes for Retailers
For convenience retailers, the food and beverage visibility gap creates a persistent problem: corporate sets the planogram, but nobody knows if it made it to the shelf.
A category manager builds a product mix based on sales data and brand commitments. That planogram travels down through layers of the organization and somewhere between the decision and execution, things slip. A product is unavailable from the local supplier. A store manager makes a call. An employee merchandises from memory. By the next review cycle, what is in the cooler may bear little resemblance to what was planned.
Close the visibility gap and compliance becomes verifiable, not assumed. Executives see performance across the full network without visiting every location. Store operators see exactly how their planogram compares to what corporate intended and can flag when local supply makes it impossible to execute.
Stoc has observed that many planogram arguments inside organizations are not really about the product. They are about whose numbers to believe. A shared source of performance data does not just resolve those debates. It makes them unnecessary.
The Alignment Nobody Talks About
There is a benefit to closing the food and beverage visibility gap that does not get enough attention and may have the deepest long-term impact. It is alignment.
When data lives in different places, it goes out of sync. Teams argue about which numbers are correct before they can agree on what to do. An operations team works from one report. A category team works from another. A field team has its own read. All three are looking at real data, just different slices of it.
Here is what that looks like on the ground. A category manager believes a product is underperforming based on rolled-up sales data. A field operator knows it sells out every afternoon but gets restocked inconsistently. Both are right. But because they are looking at different slices of the same reality, they end up in a debate instead of a decision. The category manager pushes to reduce facings. The field operator pushes back. Nobody wins, and the shelf stays the same.
A shared view of the shelf, what sold, what stocked out, how long it was unavailable, what demand actually looks like at that location, makes that debate unnecessary. The data answers the question before the argument starts.
Once everyone is pushing in the same direction with the same understanding of why, the momentum compounds. Shared information leads to shared interpretation, shared priorities, and coordinated action. That is not a technology outcome. That is a business one.
From Five Tools to One Conversation
Here is what a typical workflow looks like today for an operator making a planogram decision.
They notice a product underperforming. They open a second system to verify the sales export. A third to model what changes if the assortment shifts. A fourth to build the updated planogram. A fifth to communicate it to the field and track whether it was implemented.
Picture what that looks like at 4pm on an event day. Someone pulls a report, flags a product, and needs to make a call before tomorrow. They open four tabs, chase an email thread to find out whether the field team already made a change on site, and by the time they have enough information to decide, the window to act has already closed. And that assumes every system is current, which it rarely is.
Five tools. Five login paths. Five points where data drifts out of sync. No confirmation at the end that any of it worked.
When all of that happens in one interface, the workflow does not just get faster. It gets more accurate. Actions are taken on the same data that surfaced the problem. Impact is tracked against the same baseline that informed the decision. The loop closes.
What the Numbers Could Actually Look Like
The financial upside of closing the food and beverage visibility gap is larger than most operators expect.
Start at the unit level. A product with a $3/hour sales velocity is available for 10 hours at an event and sells out after 2. The revenue from those 8 hours is gone, not deferred. That is $24 lost from one slot, one cooler, one event. Across multiple products, multiple coolers, and a network of locations, the number compounds fast. [1]
Fragmented systems make that loss invisible. Research on disconnected retail inventory data finds that retailers lose between 5% and 15% of annual revenue from fragmentation, stockouts, and delayed demand signals. [2] For an operation doing $18M in annual revenue, that is between $900K and $2.7M walking out the door every year.
At the enterprise level, improvements in stockout rates, planogram compliance, and merchandising efficiency across tens of thousands of points of sale do not produce incremental gains. Built from a single facing in a single cooler, the math rolls up to numbers that belong in an annual report.
Those numbers depend on the operation and how aggressively teams act on what the data surfaces. The operators who win will treat visibility as a starting point for action, not a destination.
That is what changes when the blind spot disappears.
Frequently Asked Questions
Sources
[1] NetSuite, Stockouts Defined: https://www.netsuite.com/portal/resource/articles/inventory-management/stockout.shtml
[2] House of MarTech, The Cost of Inaction: What Fragmented Data Actually Costs: https://houseofmartech.com/blog/the-cost-of-inaction-what-fragmented-customer-data-actually-costs-your-business