Retail Shelf Intelligence: 3 Stockout Patterns Visibility Reveals
Stoc Brief
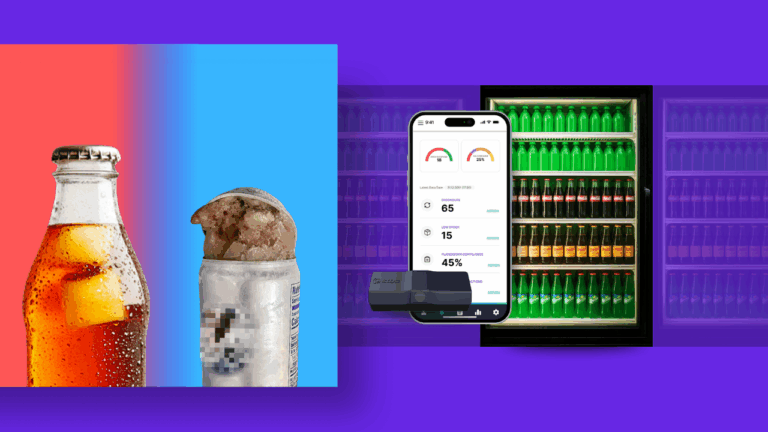
- Stockouts are often treated as unavoidable, but in reality they are predictable outcomes of missing shelf visibility and poor measurement at the cooler.
- Retail shelf intelligence reveals that most stockouts follow clear patterns by location, SKU, and time of day, driven by concentrated demand and operational handoffs.
- When shelf data is connected at the enterprise level, teams can move from reacting to stockouts to preventing them through better execution, timing, and accountability.
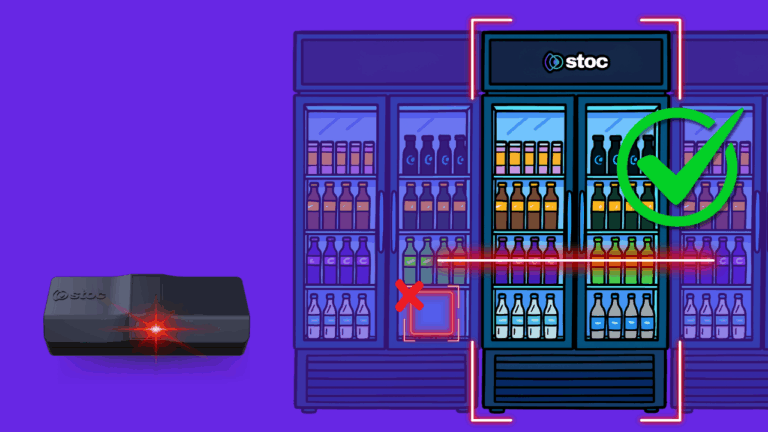
The Real Problem Is Visibility, Not Effort
Stockouts are often treated as an unavoidable cost of operating coolers. Products sell faster than expected. Vendors miss a stop. Staff get pulled in other directions. Shelves go empty.
In reality, stockouts are one of the clearest signals of whether retail shelf intelligence exists or not.
Most operators already care deeply about execution. They invest in planograms, audits, restocking schedules, and vendor agreements. Teams are working hard.
The issue is not effort. The issue is measurement.
If you cannot measure what is happening at the shelf, you cannot improve it. Without shelf visibility, retail execution breaks silently between resets.
When shelf conditions are invisible, teams rely on assumptions, periodic audits, or lagging sales data. Stockouts go unnoticed until revenue is already lost, and by then the root cause is difficult to diagnose.
Pattern 1: Stockouts Are Concentrated, Not Widespread
This is the first signal retail shelf intelligence reveals once visibility exists.
In large enterprise environments, nearly all stockout exposure consistently comes from a small number of cooler locations and SKUs.
What we have observed in the field:
- Around 90 percent of stockouts can be traced back to just a handful of cooler locations
- Roughly 70 percent of stockouts are driven by fewer than ten products
This reframes the problem. Stockouts are not happening everywhere. They are happening in very specific places. Without shelf visibility, those places remain hidden.
Pattern 2: Stockouts Follow Predictable Time Windows
The second pattern becomes clear when shelf data is analyzed over time.
Stockouts do not occur evenly throughout the day. They cluster around specific, repeatable windows that align with demand and staffing coverage.
What we have repeatedly seen across large enterprise and convenience retail environments:
- Morning carryover stockouts from overnight gaps
- Midday dips when fixed restock schedules temporarily restore availability
- Afternoon spikes when demand increases but ownership and staffing drop off
In convenience retail environments, interaction data reveals clear daypart demand patterns across breakfast, lunch, and afternoon or evening periods, with different categories peaking at different times.
Without shelf-level measurement, these patterns are invisible. With it, they become obvious.
Stockouts are not random events. They are predictable failures that happen during windows when no one is watching.
Pattern 3: Execution Breaks at Handoffs, Not in the Planogram
When stockouts persist, the instinct is often to blame the planogram. In practice, the planogram is rarely the root cause.
A planogram is a visual guide that defines how products should be placed on a shelf to support availability and performance. Planogram compliance measures whether that guide is followed over time.
What consistently breaks execution are operational handoffs.
What we see most often:
- Fixed restock schedules that miss peak demand
- Alerts routed to a single person who is not always onsite
- Late-day issues that persist overnight
- High-velocity SKUs under-faced relative to actual demand
When shelf conditions are not measured, these failures feel anecdotal. With shelf visibility, they become measurable and actionable.
What These Patterns Unlock
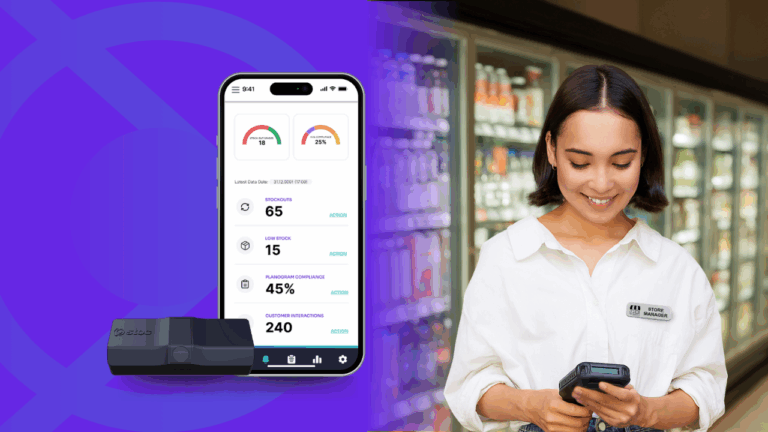
Once you can see stockouts clearly, teams stop guessing and start fixing.
Retail shelf intelligence turns stockouts from a constant surprise into a solvable operating model:
- Focus effort where it matters most, not everywhere
- Align restock and coverage to real demand windows
- Close execution gaps at handoffs
- Maintain standards like planogram compliance without constant resets
This is where proof matters. In real-world enterprise environments, we have observed outcomes like:
- Sustained planogram compliance above 95 percent
- On-shelf availability improving by approximately 20 percent
- Out-of-stock events reduced by approximately 25 percent and duration reduced by roughly 20 percent in high-velocity cooler environments
- Measurable sales lift and additional upside unlocked by reducing recurring stockout patterns
These are not projections. They are outcomes observed in live environments.
How to Fix It at Scale
Fixing one cooler is helpful. Fixing the same issues across hundreds or thousands of locations is transformative.
The most durable way to prevent stockouts from recurring is a connected enterprise data system that turns shelf visibility into repeatable action.
What changes when visibility is connected across the enterprise:
- Patterns surface earlier across locations
- Fixes standardize faster once proven
- Accountability becomes shared rather than reactive
- Teams can benchmark execution and availability by location, door, category, and daypart
Visibility at one location solves a problem. Visibility across an enterprise prevents it from coming back.
Reframing the Stockout Conversation
Stockouts are not an unavoidable cost of doing business. They are a visibility failure that looks like an execution problem.
When enterprises can continuously measure shelf reality at scale, they stop guessing and start fixing what actually matters.
The patterns are already there. You just have to be able to see them.