How to Create a Planogram with Stoc
Planogram Recap
Planograms have been around for decades, but too often they’re treated like static shelf maps that get updated a few times a year and never reflect what customers actually want. In the fast-moving world of beverage sales, that approach doesn’t cut it anymore. Shopper habits change every week, new products hit shelves every month, and retailer expectations are higher than ever.
A planogram that isn’t built on live data is just guessing.
That’s where Stoc comes in. Our AI-powered planogram creator makes it quick and simple to build layouts that are dynamic, localized, and backed by real performance data. Whether you’ve used planograms before or not, Stoc gives you the tools to turn your shelves into sales machines.
Why Planograms Still Matter
A planogram is more than a shelf map. It’s a strategy that drives results:
- Visibility: Products at eye level or within reach sell faster and get picked up more often.
- Consistency: Retailers want layouts that match expectations and stay compliant.
- Performance Tracking: Clean, consistent layouts make data more reliable, which makes it easier to measure results and prove success.
Planograms are the bridge between strategy and execution. Done right, they make shelves shoppable and profitable. Done poorly, they leave money on the table.
The Problem with Traditional Planograms
Traditional planograms fall short for a few reasons:
- They’re static, usually refreshed just once or twice a year.
- They’re regionalized, treating a downtown Chicago store the same as a suburban Milwaukee gas station.
- They’re resource-heavy, requiring retraining of teams every time an update rolls out.
The result is mismatched shelves, missed opportunities, and wasted effort. Everyone knows there’s a better way.
How Stoc Reinvents the Planogram
Stoc’s planogram creator makes the process faster, smarter, and easier to use:
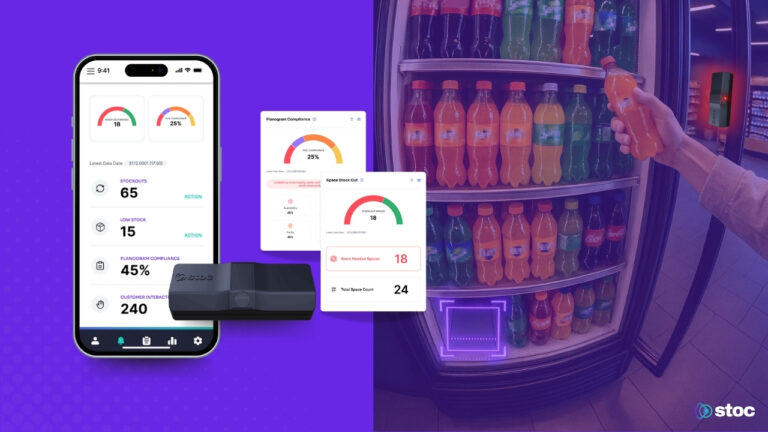
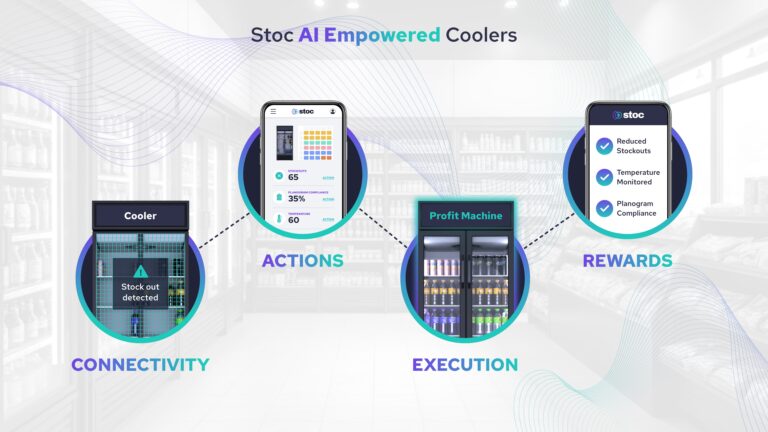
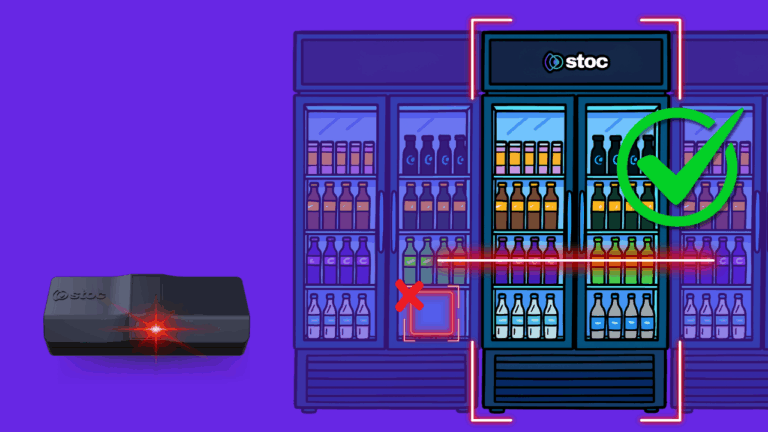
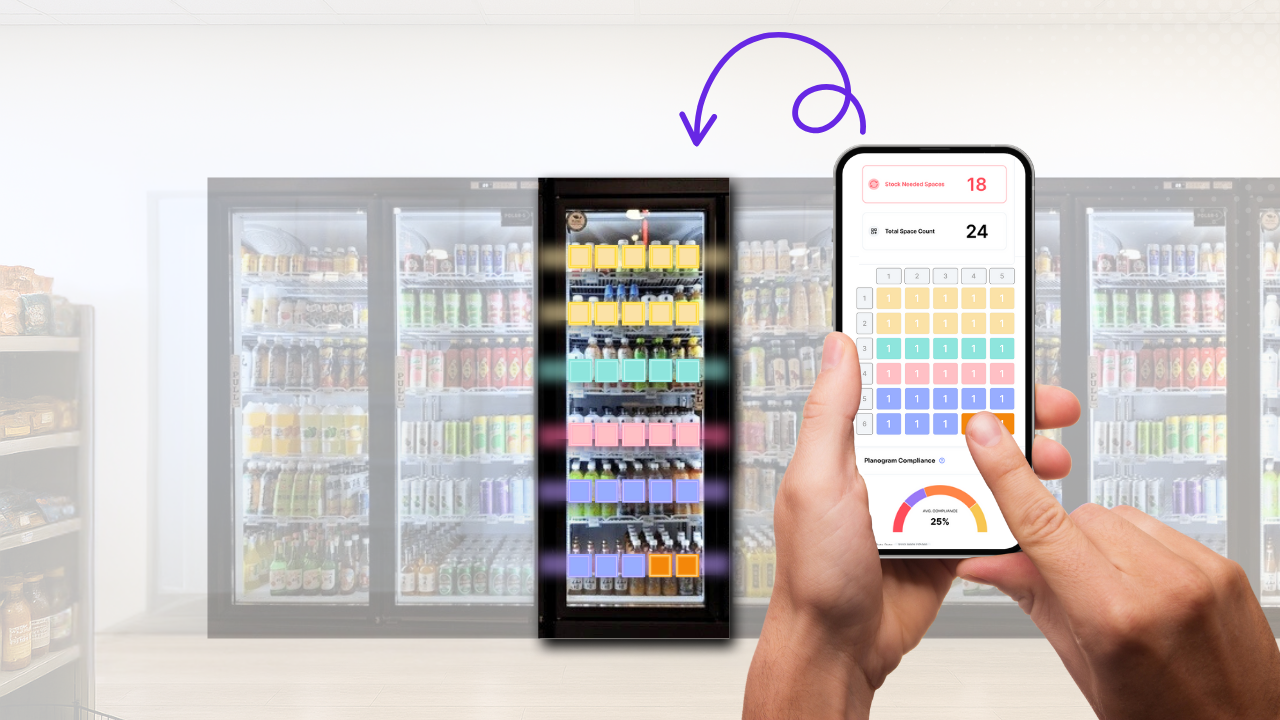
- Real-Time Data Collection: Peel-and-stick cameras and sensors capture what’s happening in every cooler, from stock outs to shopper activity. Data is always fresh.
- AI-Driven Optimization: Stoc analyzes live data to show what actually sells in each store. No assumptions, just facts. The AI then creates a planogram designed to maximize impact.
- Quick Creation: You can build an optimized planogram in minutes. Even if you’ve never used one before, the process is simple.
- Easy Field Execution: Visual mobile guides show teams exactly what to do, and compliance can be verified through photos.
- Continuous Learning: Shopper habits change all the time. Stoc adjusts in real time to keep layouts sharp.
The Value Even if You Don’t Use Planograms Today
Planograms can seem unnecessary if you’ve never used them. But with Stoc, the benefits show up right away:
- Clarity: Data-backed layouts make placement decisions simple.
- Credibility: Retailers see you as a partner they can count on.
- Confidence: You know your shelves are set up to win.
Even if you’re starting from scratch, Stoc puts you on the same playing field as the big distributors.
Democratizing Local Insights
The biggest win with Stoc is that every store gets a planogram built for its unique shoppers:
- A store near a university leans into energy drinks and single-serve coffee.
- A suburban store highlights multi-packs and family-size bottles.
- A rural store focuses on traditional soft drinks and bulk buys.
This creates stronger retailer relationships and sharper sales strategies.
A Daily Playbook for Success
Planograms with Stoc aren’t one-time layouts, they’re part of the daily rhythm:
- Morning: Teams get fresh recommendations.
- Daytime: Stock outs trigger alerts so they’re fixed before sales are lost.
- Weekly: Layouts refresh with updated insights.
- Monthly: Retailers receive compliance and performance reports.
This rhythm keeps distributors proactive instead of reactive.
From Data to Action
Most systems give you plenty of data but stop short of telling you what to do. Stoc closes that gap, turning cooler insights into actions:
- Move this product higher.
- Restock this SKU now.
- Adjust this shelf before the weekend.
It’s the difference between collecting information and actually driving profit.
The Bottom Line
Planograms don’t have to be static diagrams. With Stoc, they’re living strategies that adapt to shopper behavior in real time. Whether you’re new to planograms or a seasoned operator, Stoc makes it fast, simple, and effective.
Creating a planogram with Stoc means less guesswork, more sales, and stronger retailer relationships.
Every cooler becomes a source of truth. Every shelf becomes a strategy. That’s what planograms should be.