Replacing Regional Planograms with Location-Based Intelligence: The Future of Retail Optimization
The Problem with Traditional Planogram Management
Walk into a convenience store anywhere in the country and you’ll probably see the same product layout in every cooler. That’s not by chance—it’s the result of regional planograms that dictate product placement across hundreds of stores.
The problem? A downtown Chicago store and a suburban Milwaukee gas station serve completely different customers but follow the same merchandising strategy. One sells premium coffee drinks by the case, the other pushes family-size sodas on weekends—yet both look identical.
This one-size-fits-all approach leaves sales on the table.
The Limitations of Static Regional Planograms
Traditional planograms are rigid and outdated. They come with built-in challenges:
- Infrequent updates: Most are updated just 1–3 times per year, meaning months of missed trends, product launches, and shifting preferences.
- Training bottlenecks: Every adjustment requires retraining field teams across wide territories, slowing optimization.
- No localization: A store near a university has different shoppers than one near a construction site, yet both follow the same plan.
- Limited visibility: Without real-time performance data, retailers rely on quarterly reports and sporadic visits.
- Missed revenue: Static layouts can’t react to trending products, supply chain issues, or local demand spikes.
Research shows that optimized planograms can increase sales by 15% in categories like beverages and snacks. But most retailers are missing the tools to get there.
The Rise of Location-Based Intelligence
The solution is cooler intelligence, real-time visibility powered by IoT sensors and computer vision. The global beverage cooler market is projected to reach $5.77 billion by 2030, driven by smart technologies that transform merchandising.
Cooler intelligence makes possible:
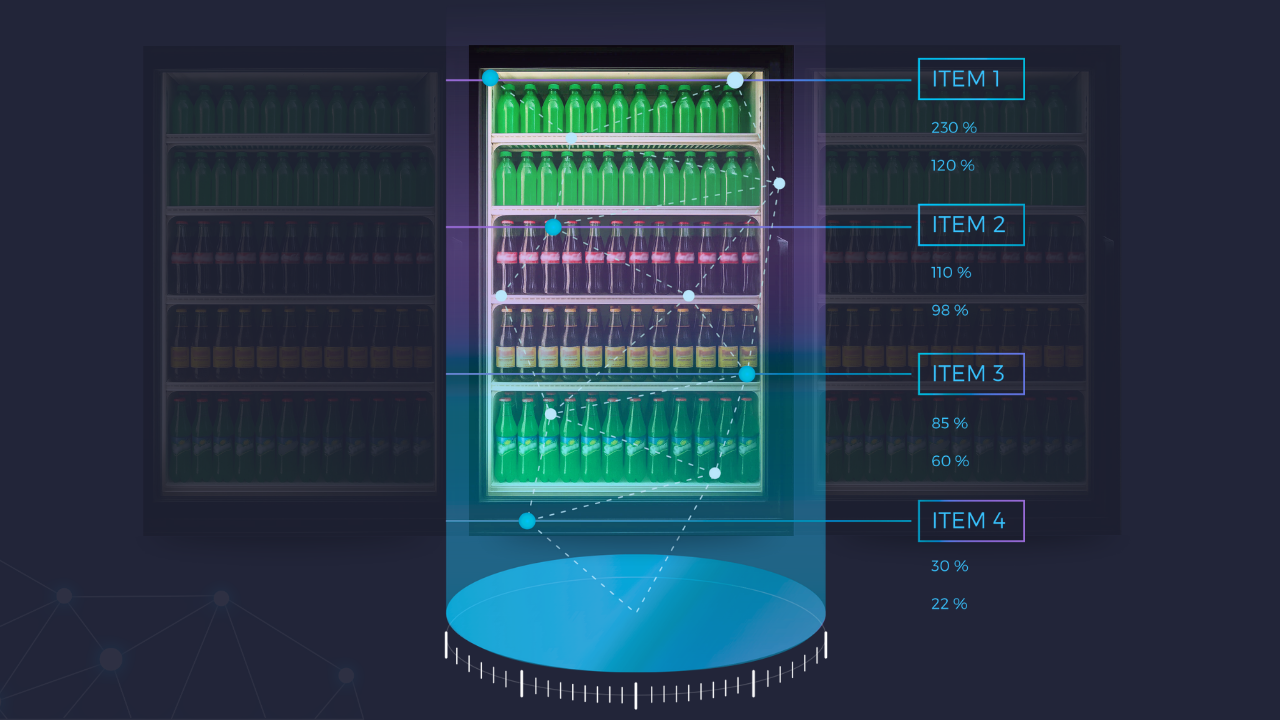
- Real-time shelf monitoring to see exactly what sells, where, and when.
- Localized preference mapping that replaces assumptions with actual purchase behavior.
- Dynamic responses that adjust dynamic planograms instantly for seasonality, events, or trends.
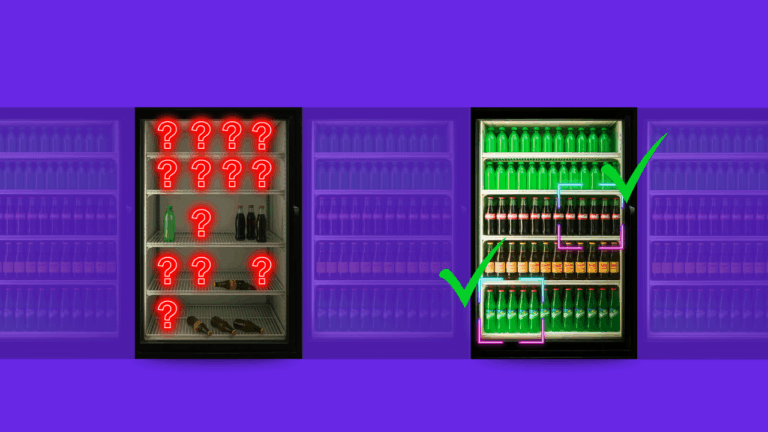
- Automated compliance that verifies execution without guesswork.
In short, every retail cooler becomes a data source, and every location gains a tailored strategy.
Introducing Dynamic Planograms
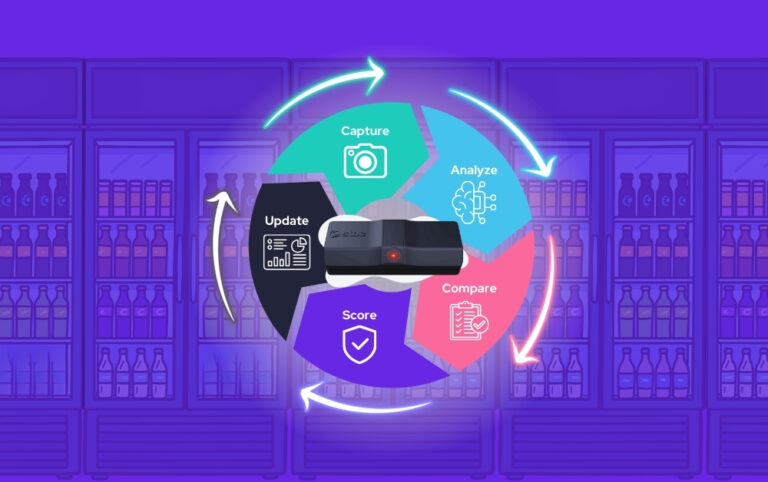
Dynamic planograms move retailers beyond static regional layouts into location-based optimization. Here’s how they work:
- Data-driven optimization: Every product interaction is tracked, from door openings to sales.
- AI-powered cooler insights: Algorithms recommend placements that maximize sales.
- Real-time deployment: Field teams receive visual guides via mobile apps.
- Continuous learning: The system improves with every cycle of data.
The result? Faster adjustments, smarter layouts, and more revenue at every store.
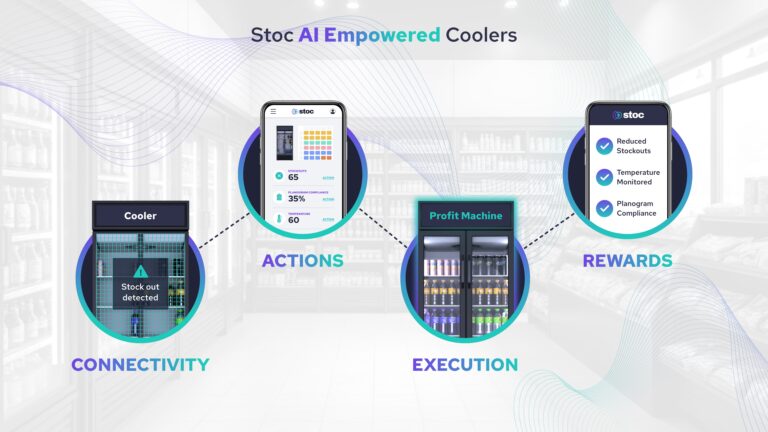
How Stoc Delivers Dynamic Planograms
Stoc makes dynamic planograms possible by turning cooler data into action.
- Stock monitoring: Real-time alerts when products run low or stock out.
- Door analytics: Understand shopper behavior by tracking access patterns.
- Compliance verification: Ensure planograms are followed across all stores.
- Environmental monitoring: Track cooler conditions that impact sales.
With Stoc, merchandising teams can:
- Identify top-selling products at each location.
- Time changes for peak sales hours.
- Adjust planograms instantly as demand shifts.
- Prove compliance with photo and data verification in real time.
This data-driven precision builds trust with retailers and ensures consistency at scale.
Real-World Impact
Switching from regional to location-based strategies drives measurable results:
- Increased sales: Dynamic planograms deliver 10–30% sales lifts in test locations. Deloitte research shows hyper-personalized retail is replacing mass-market approaches.
- Smarter inventory: Real-time monitoring reduces stock outs and overstocks, improving cash flow.
- Stronger brand performance: Products land in the right place at the right time.
- Lower costs: Automated monitoring reduces labor tied to manual checks.
- Faster response: Retailers can pivot quickly to trends, supply disruptions, or events.
Case Example
A retailer with urban, suburban, and rural stores would normally apply one regional planogram across all three. With Stoc:
- Urban stores optimize for commuter rush hours with premium energy drinks and coffee.
- Suburban stores prioritize family-size packs for weekend sales.
- Rural stores focus on soft drinks and bulk items for longer shopping trips.
Each store gets a merchandising strategy tailored to its shoppers.
The Future of Merchandising
Dynamic planograms are just the beginning. As AI in retail evolves, retailers will unlock predictive merchandising, cross-category optimization, and even personalized experiences for loyalty members.
Studies already show that retailers using AI inventory management and machine learning achieve about 8% higher annual profit growth than competitors. Dynamic planograms are a crucial step toward that future.
Bottom Line
The era of static regional planograms is over. With Stoc’s cooler intelligence platform, retailers and CPG brands finally gain the real-time visibility needed to optimize at the store level.
Dynamic planograms are available today. The only question: will you adopt now or wait while competitors seize the advantage?
Ready to win at the shelf? Contact Stoc and turn your cooler data into the merchandising edge retailers demand.